Charts
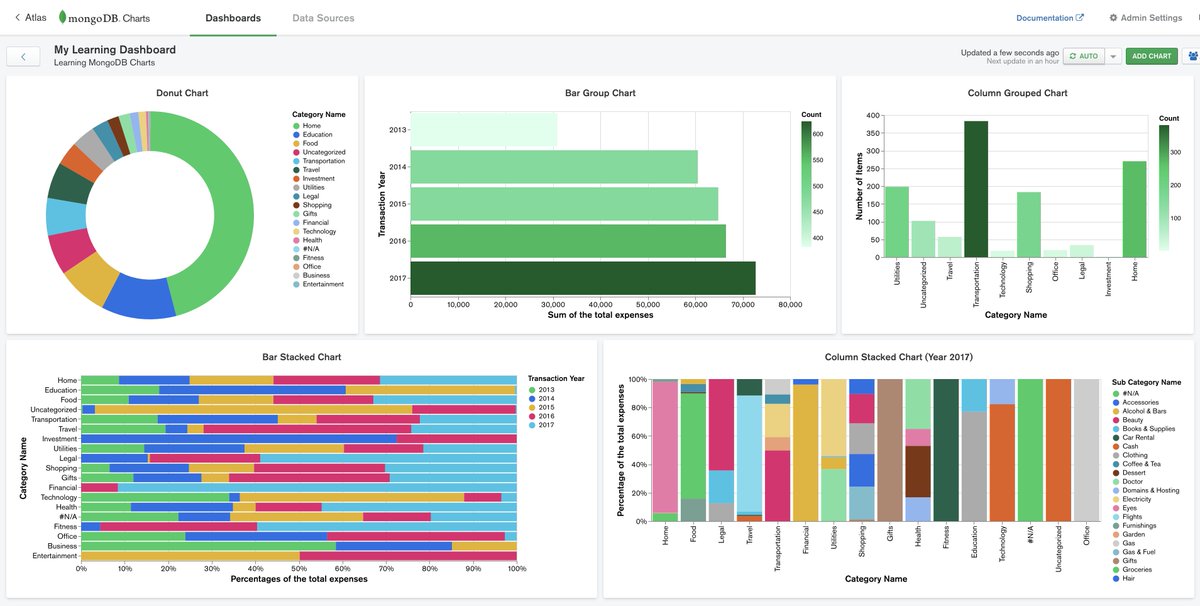
Charts are far better for displaying data visually than tables and have the added benefit that no one is ever going to press-gang them into use as a layout tool. They’re easier to look at and convey data quickly, but they’re not always easy to create.
A great way to get started with charts is with Chart.js, a JavaScript plugin that uses HTML5’s canvas element to draw the graph onto the page. It’s a well documented plugin that makes using all kinds of bar charts, line charts, pie charts and more, incredibly easy. to know more about charts visit this page
The <canvas> element
 The HTML <canvas> element is used to draw graphics, on the fly, via JavaScript.
The <canvas> element is only a container for graphics. You must use JavaScript to actually draw the graphics.
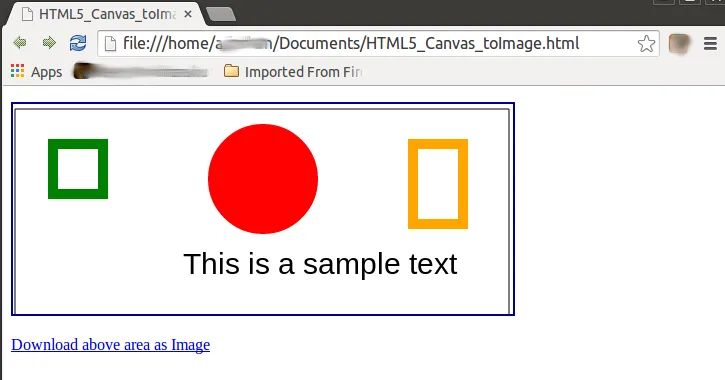
Canvas has several methods for drawing paths, boxes, circles, text, and adding images. if are interested to know about canvas visit this page
## Drawing shapes with canvas
The grid
 Before we can start drawing, we need to talk about the canvas grid or coordinate space. Our HTML skeleton from the previous page had a canvas element 150 pixels wide and 150 pixels high. To the right, you see this canvas with the default grid overladed. Normally 1 unit in the grid corresponds to 1 pixel on the canvas. The origin of this grid is positioned in the top left corner at coordinate (0,0). All elements are placed relative to this origin. So the position of the top left corner of the blue square becomes x pixels from the left and y pixels from the top, at coordinate (x,y). Later in this tutorial we’ll see how we can translate the origin to a different position, rotate the grid and even scale it, but for now we’ll stick to the default.